![]() itécon
itécon
<<Retour au sommaire : ANALYSE ÉCONOMIQUE
Rapport mondial sur le développement humain 2007-2008
http://hdr.undp.org/en/reports/global/hdr2007-2008/chapters/french/
Rapport mondial sur le développement humain 2007-2008
"Sélection"
3 pages :
Crime et justice (sic).
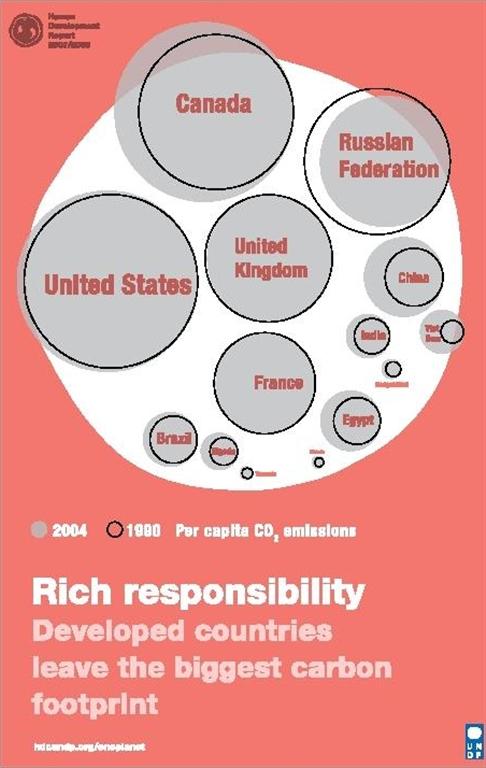
Les émissions de dioxyde de carbone. (ci-dessous)
------------------------------
Les émissions de dioxyde de carbone
Le tableau complet excel ou pdf
Total Annual change Share of
world totalbPer capita Carbon intensity
of energy
CO2 emissions
per unit of energy useCarbon intensity
of growth
CO2 emissions
per unit of GDPCarbon dioxide emissions from forest biomassc Carbon stocks in forest biomassd (Mt CO2) (%)
(%)(t CO2) (kt of CO2 per
kt of oil equivalent)(kt of CO2 per million
2000 PPP US$)(Mt CO2 / year) (Mt Carbon) HDI rank 1990 2004 1990-2004 1990 2004 1990 2004 1990 2004 1990 2004 1990-2005 2005 HIGH HUMAN DEVELOPMENT 1 Iceland 2.0 2.2 0.7 (.) (.) 7.9 7.6 0.93 0.64 0.32 0.24 -0.1 1.5 2 Norway 33.2 87.5 11.7 0.1 0.3 7.8 19.1 1.54 3.17 0.31 0.53 -15.6 344.0 3 Australia 278.5 326.6 1.2 1.2 1.1 16.3 16.2 3.18 2.82 0.81 0.58 .. 8,339.0 4 Canada 415.8 639.0 3.8 1.8 2.2 15.0 20.0 1.99 2.38 0.66 0.69 .. .. 5 Ireland 30.6 42.3 2.7 0.1 0.1 8.8 10.5 2.94 2.78 0.55 0.31 -1.0 19.8 6 Sweden 49.5 53.0 0.5 0.2 0.2 5.8 5.9 1.04 0.98 0.26 0.21 -30.2 1,170.0 7 Switzerland 42.7 40.4 -0.4 0.2 0.1 6.2 5.4 1.71 1.49 0.21 0.17 -6.1 154.0 8 Japan 1,070.7 1,257.2 1.2 4.7 4.3 8.7 9.9 2.40 2.36 0.37 0.36 -118.5 1,892.0 9 Netherlands 141.0 142.0 (.) 0.6 0.5 9.4 8.7 2.11 1.73 0.41 0.30 -1.2 25.0 10 France 363.8 373.5 0.2 1.6 1.3 6.4 6.0 1.60 1.36 0.29 0.23 -44.2 1,165.0 11 Finland 51.2 65.8 2.0 0.2 0.2 10.3 12.6 1.76 1.73 0.46 0.45 -22.5 815.7 12 United States 4,818.3 6,045.8 1.8 21.2 20.9 19.3 20.6 2.50 2.60 0.68 0.56 -499.5 18,964.0 13 Spain 212.1 330.3 4.0 0.9 1.1 5.5 7.6 2.33 2.32 0.31 0.33 -28.3 392.0 14 Denmark 49.8 52.9 0.5 0.2 0.2 9.7 9.8 2.78 2.64 0.42 0.33 -1.0 26.0 15 Austria 57.6 69.8 1.5 0.3 0.2 7.4 8.6 2.30 2.10 0.32 0.29 .. .. 16 United Kingdom 579.4 586.9 0.1 2.6 2.0 10.0 9.8 2.73 2.51 0.47 0.34 -4.2 112.0 17 Belgium 100.6 100.7 (.) 0.4 0.3 10.1 9.7 2.05 1.74 0.45 0.34 -3.7 65.3 18 Luxembourg 9.9 11.3 1.0 (.) (.) 25.9 25.0 2.77 2.37 0.78 0.48 -0.5 9.0 19 New Zealand 22.6 31.6 2.8 0.1 0.1 6.7 7.7 1.65 1.79 0.39 0.35 .. .. 20 Italy 389.7 449.7 1.1 1.7 1.6 6.9 7.8 2.63 2.44 0.32 0.30 -51.9 636.0 21 Hong Kong, China (SAR) 26.2 37.4 3.1 0.1 0.1 4.6 5.5 2.46 2.18 0.23 0.19 .. .. 22 Germany 980.4 h 808.3 -1.3 4.3 h 2.8 12.3 h 9.8 2.75 2.32 0.58 h 0.38 -74.9 1,303.0 23 Israel 33.1 71.2 8.2 0.1 0.2 6.9 10.4 2.74 3.43 0.39 0.47 .. .. 24 Greece 72.4 96.6 2.4 0.3 0.3 7.1 8.8 3.26 3.17 0.49 0.43 -1.7 58.7
la copie est nécessaire le progrès l'exige.