<<Retour au sommaire : ANALYSE ÉCONOMIQUE
Rapport mondial sur le développement humain 2011
http://hdr.undp.org/en/reports/global/hdr2011/download/fr/
et
Rapport mondial sur le développement humain 2010 un peu plus bas
http://hdr.undp.org/fr/rapports/mondial/rdh2010/chapitres/fr/
et
Rapport mondial sur le développement humain
2009 un peu plus bas
http://hdr.undp.org/fr/rapports/mondial/rmdh2009/
et
Rapport mondial sur le développement humain 2007-2008
en bas de page
http://hdr.undp.org/en/reports/global/hdr2007-2008/chapters/french/
Rapport mondial sur le développement humain 2011
http://hdr.undp.org/en/reports/global/hdr2011/download/fr/

L'IDH selon le nouveau calcul (depuis le rapport 2010)
Ce tableau au format PDF ou au format excel avec toutes les statistiques
| Human Development Index (HDI) | Life expectancy at birth | Mean years of schooling | Expected years of schooling | Gross National Income (GNI) per capita | GNI per capita rank minus HDI rank | Nonincome HDI | ||
| HDI rank | Value | (years) | (years) | (years) | (Constant 2005 PPP$) | Value | ||
| 2011 | 2011 | 2011 | 2011 | 2011 | 2011 | 2011 | ||
| VERY HIGH HUMAN DEVELOPMENT | ||||||||
| 1 | Norway | 0,943 | 81,1 | 12,6 | 17,3 | 47 557 | 6 | 0,975 |
| 2 | Australia | 0,929 | 81,9 | 12,0 | 18,0 | 34 431 | 16 | 0,979 |
| 3 | Netherlands | 0,910 | 80,7 | 11,6 | 16,8 | 36 402 | 9 | 0,944 |
| 4 | United States | 0,910 | 78,5 | 12,4 | 16,0 | 43 017 | 6 | 0,931 |
| 5 | New Zealand | 0,908 | 80,7 | 12,5 | 18,0 | 23 737 | 30 | 0,978 |
| 6 | Canada | 0,908 | 81,0 | 12,1 | 16,0 | 35 166 | 10 | 0,944 |
| 7 | Ireland | 0,908 | 80,6 | 11,6 | 18,0 | 29 322 | 19 | 0,959 |
| 8 | Liechtenstein | 0,905 | 79,6 | 10,3 | 14,7 | 83 717 | -6 | 0,877 |
| 9 | Germany | 0,905 | 80,4 | 12,2 | 15,9 | 34 854 | 8 | 0,940 |
| 10 | Sweden | 0,904 | 81,4 | 11,7 | 15,7 | 35 837 | 4 | 0,936 |
| 11 | Switzerland | 0,903 | 82,3 | 11,0 | 15,6 | 39 924 | 0 | 0,926 |
| 12 | Japan | 0,901 | 83,4 | 11,6 | 15,1 | 32 295 | 11 | 0,940 |
| 13 | Hong Kong, China (SAR) | 0,898 | 82,8 | 10,0 | 15,7 | 44 805 | -4 | 0,910 |
| 14 | Iceland | 0,898 | 81,8 | 10,4 | 18,0 | 29 354 | 11 | 0,943 |
| 15 | Korea (Republic of) | 0,897 | 80,6 | 11,6 | 16,9 | 28 230 | 12 | 0,945 |
| 16 | Denmark | 0,895 | 78,8 | 11,4 | 16,9 | 34 347 | 3 | 0,926 |
| 17 | Israel | 0,888 | 81,6 | 11,9 | 15,5 | 25 849 | 14 | 0,939 |
| 18 | Belgium | 0,886 | 80,0 | 10,9 | 16,1 | 33 357 | 2 | 0,914 |
| 19 | Austria | 0,885 | 80,9 | 10,8 | 15,3 | 35 719 | -4 | 0,908 |
| 20 | France | 0,884 | 81,5 | 10,6 | 16,1 | 30 462 | 4 | 0,919 |
| 21 | Slovenia | 0,884 | 79,3 | 11,6 | 16,9 | 24 914 | 11 | 0,935 |
| 22 | Finland | 0,882 | 80,0 | 10,3 | 16,8 | 32 438 | 0 | 0,911 |
| 23 | Spain | 0,878 | 81,4 | 10,4 | 16,6 | 26 508 | 6 | 0,920 |
| 24 | Italy | 0,874 | 81,9 | 10,1 | 16,3 | 26 484 | 6 | 0,914 |
| 25 | Luxembourg | 0,867 | 80,0 | 10,1 | 13,3 | 50 557 | -20 | 0,854 |
| ,,, | ,,, | |||||||
| 45 | Argentina | 0,797 | 75,9 | 9,3 | 15,8 | 14 527 | 9 | 0,843 |
| 46 | Croatia | 0,796 | 76,6 | 9,8 | 13,9 | 15 729 | 5 | 0,834 |
| 47 | Barbados | 0,793 | 76,8 | 9,3 | 13,4 | 17 966 | -3 | 0,818 |
| HIGH HUMAN DEVELOPMENT | ||||||||
| 48 | Uruguay | 0,783 | 77,0 | 8,5 | 15,5 | 13 242 | 12 | 0,828 |
| 49 | Palau | 0,782 | 71,8 | 12,1 | 14,7 | 9 744 | 29 | 0,853 |
| 50 | Romania | 0,781 | 74,0 | 10,4 | 14,9 | 11 046 | 20 | 0,841 |
| 51 | Cuba | 0,776 | 79,1 | 9,9 | 17,5 | 5 416 | 52 | 0,904 |
| ,,, | ,,, | |||||||
| 92 | Turkey | 0,699 | 74,0 | 6,5 | 11,8 | 12 246 | -25 | 0,704 |
| 93 | Belize | 0,699 | 76,1 | 8,0 | 12,4 | 5 812 | 9 | 0,766 |
| 94 | Tunisia | 0,698 | 74,5 | 6,5 | 14,5 | 7 281 | 2 | 0,745 |
| MEDIUM HUMAN DEVELOPMENT | ||||||||
| 95 | Jordan | 0,698 | 73,4 | 8,6 | 13,1 | 5 300 | 9 | 0,773 |
| 96 | Algeria | 0,698 | 73,1 | 7,0 | 13,6 | 7 658 | -5 | 0,739 |
| ,,, | ,,, | |||||||
| 134 | India | 0,547 | 65,4 | 4,4 | 10,3 | 3 468 | -10 | 0,568 |
| 135 | Ghana | 0,541 | 64,2 | 7,1 | 10,5 | 1 584 | 20 | 0,633 |
| 136 | Equatorial Guinea | 0,537 | 51,1 | 5,4 | 7,7 | 17 608 | -91 | 0,458 |
| 137 | Congo | 0,533 | 57,4 | 5,9 | 10,5 | 3 066 | -6 | 0,555 |
| 138 | Lao People's Democratic Republic | 0,524 | 67,5 | 4,6 | 9,2 | 2 242 | 4 | 0,569 |
| 139 | Cambodia | 0,523 | 63,1 | 5,8 | 9,8 | 1 848 | 11 | 0,584 |
| 140 | Swaziland | 0,522 | 48,7 | 7,1 | 10,6 | 4 484 | -27 | 0,512 |
| 141 | Bhutan | 0,522 | 67,2 | 2,3 | 11,0 | 5 293 | -36 | 0,500 |
| LOW HUMAN DEVELOPMENT | ||||||||
| 142 | Solomon Islands | 0,510 | 67,9 | 4,5 | 9,1 | 1 782 | 10 | 0,567 |
| 143 | Kenya | 0,509 | 57,1 | 7,0 | 11,0 | 1 492 | 15 | 0,584 |
| ,,, | ,,, | |||||||
| 186 | Niger | 0,295 | 54,7 | 1,4 | 4,9 | 641 | -4 | 0,311 |
| 187 | Congo (Democratic Republic of the) | 0,286 | 48,4 | 3,5 | 8,2 | 280 | -1 | 0,399 |
| HDI groupings | ||||||||
| Very high human development | 0,889 | 80,0 | 11,3 | 15,9 | 33 352 | — | 0,918 | |
| High human development | 0,741 | 73,1 | 8,5 | 13,6 | 11 579 | — | 0,769 | |
| Medium human development | 0,630 | 69,7 | 6,3 | 11,2 | 5 276 | — | 0,658 | |
| Low human development | 0,456 | 58,7 | 4,2 | 8,3 | 1 585 | — | 0,478 | |
| Regions | ||||||||
| Arab States | 0,641 | 70,5 | 5,9 | 10,2 | 8 554 | — | 0,643 | |
| East Asia and the Pacific | 0,671 | 72,4 | 7,2 | 11,7 | 6 466 | — | 0,709 | |
| Europe and Central Asia | 0,751 | 71,3 | 9,7 | 13,4 | 12 004 | — | 0,785 | |
| Latin America and the Caribbean | 0,731 | 74,4 | 7,8 | 13,6 | 10 119 | — | 0,767 | |
| South Asia | 0,548 | 65,9 | 4,6 | 9,8 | 3 435 | — | 0,569 | |
| Sub-Saharan Africa | 0,463 | 54,4 | 4,5 | 9,2 | 1 966 | — | 0,467 | |
| Least developed countries | 0,439 | 59,1 | 3,7 | 8,3 | 1 327 | — | 0,467 | |
| Small island developing states | 0,640 | 69,6 | 7,3 | 10,8 | 5 200 | — | 0,675 | |
| World | 0,682 | 69,8 | 7,4 | 11,3 | 10 082 | — | 0,683 | |
| DEFINITIONS | ||||||||
| Human Development Index (HDI) : A composite index measuring average achievement in three basic dimensions of human development—a long and healthy life, knowledge and a decent standard of living. | ||||||||
| Life expectancy at birth : Number of years a newborn infant could expect to live if prevailing patterns of age-specific mortality rates at the time of birth stay the same throughout the infant’s life. | ||||||||
| Mean years of schooling : Average number of years of education received by people ages 25 and older, converted from education attainment levels using official durations of each level. | ||||||||
| Expected years of schooling : Number of years of schooling that a child of school entrance age can expect to receive if prevailing patterns of age-specific enrolment rates persist throughout the child’s life. | ||||||||
| Gross national income (GNI) per capita : Aggregate income of an economy generated by its production and its ownership of factors of production, less the incomes paid for the use of factors of production owned by the rest of the world, converted to internat | ||||||||
| GNI per capita rank minus HDI rank : Difference in rankings by GNI per capita and by the HDI. A negative value means that the country is better ranked by GNI than by the HDI. | ||||||||
| Nonincome HDI : Value of the HDI computed from the life expectancy and education indicators only. | ||||||||
Rapport mondial sur le développement humain 2010
http://hdr.undp.org/fr/rapports/mondial/rdh2010/chapitres/fr/

Introduction par Amartya Sen (extrait)
.../...
Cependant, la difficulté de remplacer un chiffre simple comme le PNB par une avalanche de tableaux (et un vaste ensemble d’analyses apparentées) est que cette dernière n’offre pas la même facilité d’utilisation que le grossier PNB. Un indice simple, l’indice de développement humain (IDH), fut alors conçu avec pour objectif explicite de rivaliser avec le PNB, en se concentrant exclusivement sur la durée de vie, l’éducation de base et le revenu minimal. Il n’est pas surprenant que l’IDH, qui se révéla très populaire dans les discussions publiques, ait une « rusticité » rappelant celle du PNB. Ce diagnostic ne doit pas être mal interprété. Ayant eu le privilège de travailler avec Mahbub lors de la conception de l’IDH, je dirais que cet IDH réussit ce qu’on attendait de lui : faire office de mesure simple comme le PNB mais, à la différence de celui-ci, sans faire l’impasse sur tout ce qui n’est pas revenu et marchandises. Toutefois, la portée immense de l’approche du développement humain ne doit pas être réduite, comme elle l’est parfois, au champ étroit de l’IDH.
.../...
Une modification du calcul de l'IDH
Avant
Maintenant...
selon le nouveau rapport 2010
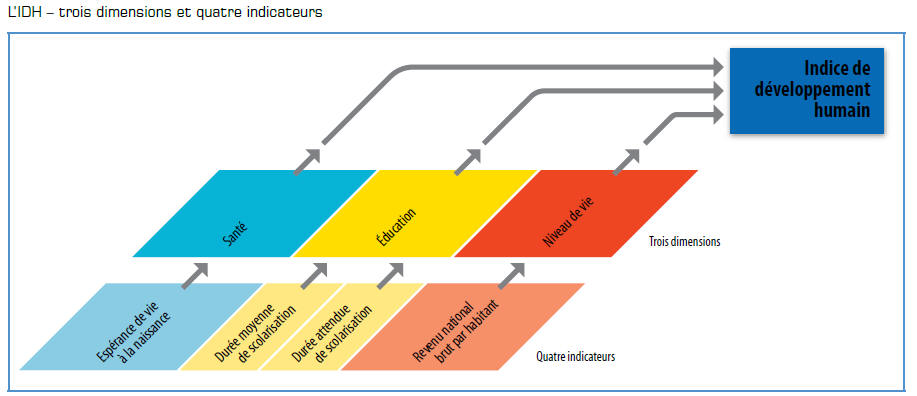
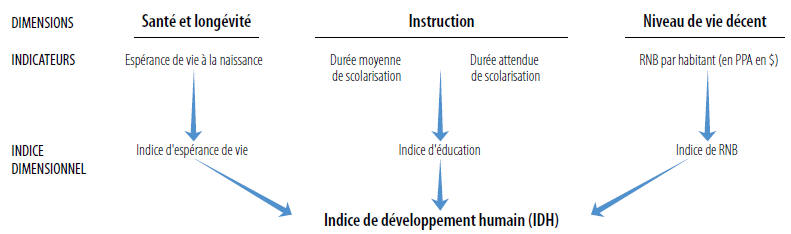
L’indice de développement humain (IDH) reste une mesure globale du progrès dans trois dimensions : la santé, l’éducation et le revenu. Cependant, dans ce Rapport, nous modifions les indicateurs utilisés pour mesurer les progrès en termes d’éducation et de revenu et nous changeons la façon dont ils sont agrégés. Dans la dimension du savoir, la durée moyenne de scolarisation remplace le taux d’alphabétisation, et le taux brut de scolarisation est reformulé en durée attendue de scolarisation - à savoir, le nombre escompté d’années de scolarisation pour un enfant, compte tenu des taux bruts de scolarisation actuels. La durée moyenne de scolarisation fait l’objet d’estimations plus fréquentes pour un plus grand nombre de pays et permet de faire une distinction entre les pays, tandis que la durée attendue de scolarisation s’inscrit dans le recadrage de cette dimension en termes d’années.
L'Indicateur de Développement Humain.
Ce tableau "Sélection" au format excel ou en pdf / le tableau complet excel
| Human Development Index (HDI)a | Life expectancy at birth | Mean years of schooling | Expected years of schooling | Gross national income (GNI) per capita | ||
| value | (years) | (years) | (years) | (PPP US$ 2008) | ||
|
HDI rank |
2010 | 2010 | 2010 | 2010b | 2010 | |
| VERY HIGH HUMAN DEVELOPMENT | ||||||
| 1 | Norway | 0,938 | 81,0 | 12,6 | 17,3 | 58 810 |
| 2 | Australia | 0,937 | 81,9 | 12,0 | 20,5 | 38 692 |
| 3 | New Zealand | 0,907 | 80,6 | 12,5 | 19,7 | 25 438 |
| 4 | United States | 0,902 | 79,6 | 12,4 | 15,7 | 47 094 |
| 5 | Ireland | 0,895 | 80,3 | 11,6 | 17,9 | 33 078 |
| 6 | Liechtenstein | 0,891 | 79,6 | 10,3 | 14,8 | 81 011 |
| 7 | Netherlands | 0,890 | 80,3 | 11,2 | 16,7 | 40 658 |
| 8 | Canada | 0,888 | 81,0 | 11,5 | 16,0 | 38 668 |
| 9 | Sweden | 0,885 | 81,3 | 11,6 | 15,6 | 36 936 |
| 10 | Germany | 0,885 | 80,2 | 12,2 | 15,6 | 35 308 |
| 11 | Japan | 0,884 | 83,2 | 11,5 | 15,1 | 34 692 |
| 12 | Korea (Republic of)g | 0,877 | 79,8 | 11,6 | 16,8 | 29 518 |
| 13 | Switzerland | 0,874 | 82,2 | 10,3 | 15,5 | 39 849 |
| 14 | France | 0,872 | 81,6 | 10,4 | 16,1 | 34 341 |
| 15 | Israel | 0,872 | 81,2 | 11,9 | 15,6 | 27 831 |
| 16 | Finland | 0,871 | 80,1 | 10,3 | 17,1 | 33 872 |
| 17 | Iceland | 0,869 | 82,1 | 10,4 | 18,2 | 22 917 |
| 18 | Belgium | 0,867 | 80,3 | 10,6 | 15,9 | 34 873 |
| 19 | Denmark | 0,866 | 78,7 | 10,3 | 16,9 | 36 404 |
| 20 | Spain | 0,863 | 81,3 | 10,4 | 16,4 | 29 661 |
| 21 | Hong Kong, China (SAR) | 0,862 | 82,5 | 10,0 | 13,8 | 45 090 |
| 22 | Greece | 0,855 | 79,7 | 10,5 | 16,5 | 27 580 |
| 23 | Italy | 0,854 | 81,4 | 9,7 | 16,3 | 29 619 |
| 24 | Luxembourg | 0,852 | 79,9 | 10,1 | 13,3 | 51 109 |
| 25 | Austria | 0,851 | 80,4 | 9,8 | 15,0 | 37 056 |
| 26 | United Kingdom | 0,849 | 79,8 | 9,5 | 15,9 | 35 087 |
| 27 | Singapore | 0,846 | 80,7 | 8,8 | 14,4 | 48 893 |
| 28 | Czech Republic | 0,841 | 76,9 | 12,3 | 15,2 | 22 678 |
| 29 | Slovenia | 0,828 | 78,8 | 9,0 | 16,7 | 25 857 |
| ,,,/,,, | ||||||
| 41 | Poland | 0,795 | 76,0 | 10,0 | 15,2 | 17 803 |
| 42 | Barbados | 0,788 | 77,7 | 9,3 | 13,4 | 21 673 |
| HIGH HUMAN DEVELOPMENT | ||||||
| 43 | Bahamas | 0,784 | 74,4 | 11,1 | 11,6 | 25 201 |
| 44 | Lithuania | 0,783 | 72,1 | 10,9 | 16,0 | 14 824 |
| 45 | Chile | 0,783 | 78,8 | 9,7 | 14,5 | 13 561 |
| 46 | Argentina | 0,775 | 75,7 | 9,3 | 15,5 | 14 603 |
| ,,,/,,, | ||||||
| 81 | Tunisia | 0,683 | 74,3 | 6,5 | 14,5 | 7 979 |
| 82 | Jordan | 0,681 | 73,1 | 8,6 | 13,1 | 5 956 |
| 83 | Turkey | 0,679 | 72,2 | 6,5 | 11,8 | 13 359 |
| 84 | Algeria | 0,677 | 72,9 | 7,2 | 12,8 | 8 320 |
| 85 | Tonga | 0,677 | 72,1 | 10,4 | 13,7 | 4 038 |
| MEDIUM HUMAN DEVELOPMENT | ||||||
| 86 | Fiji | 0,669 | 69,2 | 11,0 | 13,0 | 4 315 |
| 87 | Turkmenistan | 0,669 | 65,3 | 9,9 | 13,0 | 7 052 |
| 88 | Dominican Republic | 0,663 | 72,8 | 6,9 | 11,9 | 8 273 |
| 89 | China | 0,663 | 73,5 | 7,5 | 11,4 | 7 258 |
| ,,,/,,, | ||||||
| 125 | Pakistan | 0,490 | 67,2 | 4,9 | 6,8 | 2 678 |
| 126 | Congo | 0,489 | 53,9 | 5,9 | 9,3 | 3 258 |
| 127 | Sao Tome and Principe | 0,488 | 66,1 | 4,2 | 10,2 | 1 918 |
| LOW HUMAN DEVELOPMENT | ||||||
| 128 | Kenya | 0,470 | 55,6 | 7,0 | 9,6 | 1 628 |
| 129 | Bangladesh | 0,469 | 66,9 | 4,8 | 8,1 | 1 587 |
| 130 | Ghana | 0,467 | 57,1 | 7,1 | 9,7 | 1 385 |
| 131 | Cameroon | 0,460 | 51,7 | 5,9 | 9,8 | 2 197 |
| ,,,/,,, | ||||||
| 162 | Liberia | 0,300 | 59,1 | 3,9 | 11,0 | 320 |
| 163 | Chad | 0,295 | 49,2 | 1,5 | 6,0 | 1 067 |
| 164 | Guinea-Bissau | 0,289 | 48,6 | 2,3 | 9,1 | 538 |
| 165 | Mozambique | 0,284 | 48,4 | 1,2 | 8,2 | 854 |
| 166 | Burundi | 0,282 | 51,4 | 2,7 | 9,6 | 402 |
| 167 | Niger | 0,261 | 52,5 | 1,4 | 4,3 | 675 |
| 168 | Congo (Democratic Republic of the) | 0,239 | 48,0 | 3,8 | 7,8 | 291 |
| 169 | Zimbabwe | 0,140 | 47,0 | 7,2 | 9,2 | 176 |
| Developed | ||||||
| OECD | 0,879 | 80,3 | 11,4 | 15,9 | 37 077 | |
| Non-OECD | 0,844 | 80,0 | 10,0 | 13,9 | 42 370 | |
| Developing | ||||||
| Arab States | 0,588 | 69,1 | 5,7 | 10,8 | 7 861 | |
| East Asia and the Pacific | 0,643 | 72,6 | 7,2 | 11,5 | 6 403 | |
| Europe and Central Asia | 0,702 | 69,5 | 9,2 | 13,6 | 11 462 | |
| Latin America and the Caribbean | 0,704 | 74,0 | 7,9 | 13,7 | 10 642 | |
| South Asia | 0,516 | 65,1 | 4,6 | 10,0 | 3 417 | |
| Sub-Saharan Africa | 0,389 | 52,7 | 4,5 | 9,0 | 2 050 | |
| Very high human development | 0,878 | 80,3 | 11,3 | 15,9 | 37 225 | |
| High human development | 0,717 | 72,6 | 8,3 | 13,8 | 12 286 | |
| Medium human development | 0,592 | 69,3 | 6,3 | 11,0 | 5 134 | |
| Low human development | 0,393 | 56,0 | 4,1 | 8,2 | 1 490 | |
| Least developed countries | 0,386 | 57,7 | 3,7 | 8,0 | 1 393 | |
| World | 0,624 | 69,3 | 7,4 | 12,3 | 10 631 | |
Rapport mondial sur le développement humain 2009
http://hdr.undp.org/fr/rapports/mondial/rmdh2009/
L'Indicateur de Développement Humain en détail.
Ce tableau "Sélection" au format excel ou en pdf / le tableau complet excel
Voir la liste des pays :
Selon l'IDH (plus la liste de l'UE à 27 et de l'OCDE)
Selon le RNB (Banque mondiale)
| Human development index | Life expectancy at birth | Adult literacy rate | Combined gross enrolment ratio in education | GDP per capita | GDP per capita rank minus HDI rankb | |||
| value | (years) | (% aged 15 and above) | (%) | (PPP US$) | ||||
| HDI rank | 2007 | 2007 | 1999–2007a | 2007 | 2007 | 2007 | ||
| VERY HIGH HUMAN DEVELOPMENT | ||||||||
| 1 | Norway | 0,971 | 80,5 | .. | 98,6 | 53 433 | 4 | |
| 2 | Australia | 0,970 | 81,4 | .. | 114,2 | 34 923 | 20 | |
| 3 | Iceland | 0,969 | 81,7 | .. | 96,0 | 35 742 | 16 | |
| 4 | Canada | 0,966 | 80,6 | .. | 99,3 | 35 812 | 14 | |
| 5 | Ireland | 0,965 | 79,7 | .. | 97,6 | 44 613 | 5 | |
| 6 | Netherlands | 0,964 | 79,8 | .. | 97,5 | 38 694 | 8 | |
| 7 | Sweden | 0,963 | 80,8 | .. | 94,3 | 36 712 | 9 | |
| 8 | France | 0,961 | 81,0 | .. | 95,4 | 33 674 | 17 | |
| 9 | Switzerland | 0,960 | 81,7 | .. | 82,7 | 40 658 | 4 | |
| 10 | Japan | 0,960 | 82,7 | .. | 86,6 | 33 632 | 16 | |
| 11 | Luxembourg | 0,960 | 79,4 | .. | 94,4 | 79 485 | -9 | |
| 13 | United States | 0,956 | 79,1 | .. | 92,4 | 45 592 | -4 | |
| 14 | Austria | 0,955 | 79,9 | .. | 90,5 | 37 370 | 1 | |
| 15 | Spain | 0,955 | 80,7 | 97,9 | 96,5 | 31 560 | 12 | |
| 16 | Denmark | 0,955 | 78,2 | .. | 101,3 | 36 130 | 1 | |
| 17 | Belgium | 0,953 | 79,5 | .. | 94,3 | 34 935 | 4 | |
| 18 | Italy | 0,951 | 81,1 | 98,9 | 91,8 | 30 353 | 11 | |
| 21 | United Kingdom | 0,947 | 79,3 | .. | 89,2 | 35 130 | -1 | |
| 22 | Germany | 0,947 | 79,8 | .. | 88,1 | 34 401 | 2 | |
| 24 | Hong Kong, China (SAR) | 0,944 | 82,2 | .. | 74,4 | 42 306 | -13 | |
| 25 | Greece | 0,942 | 79,1 | 97,1 | 101,6 | 28 517 | 6 | |
| 28 | Andorra | 0,934 | .. | .. | 65,1 | 41 235 | -16 | |
| 29 | Slovenia | 0,929 | 78,2 | 99,7 | 92,8 | 26 753 | 4 | |
| 32 | Cyprus | 0,914 | 79,6 | 97,7 | 77,6 | 24 789 | 4 | |
| 34 | Portugal | 0,909 | 78,6 | 94,9 | 88,8 | 22 765 | 8 | |
| 35 | United Arab Emirates | 0,903 | 77,3 | 90,0 | 71,4 | 54 626 | -31 | |
| 36 | Czech Republic | 0,903 | 76,4 | .. | 83,4 | 24 144 | 1 | |
| 38 | Malta | 0,902 | 79,6 | 92,4 | 81,3 | 23 080 | 1 | |
| HIGH HUMAN DEVELOPMENT | ||||||||
| 39 | Bahrain | 0,895 | 75,6 | 88,8 | 90,4 | 29 723 | -9 | |
| 40 | Estonia | 0,883 | 72,9 | 99,8 | 91,2 | 20 361 | 3 | |
| 41 | Poland | 0,880 | 75,5 | 99,3 | 87,7 | 15 987 | 12 | |
| ,,,/,,, | ||||||||
| 78 | Peru | 0,806 | 73,0 | 89,6 | 88,1 | 7 836 | 7 | |
| 79 | Turkey | 0,806 | 71,7 | 88,7 | 71,1 | 12 955 | -16 | |
| 80 | Ecuador | 0,806 | 75,0 | 91,0 | .. | 7 449 | 11 | |
| 81 | Mauritius | 0,804 | 72,1 | 87,4 | 76,9 | 11 296 | -13 | |
| 82 | Kazakhstan | 0,804 | 64,9 | 99,6 | 91,4 | 10 863 | -10 | |
| 83 | Lebanon | 0,803 | 71,9 | 89,6 | 78,0 | 10 109 | -7 | |
| MEDIUM HUMAN DEVELOPMENT | ||||||||
| 84 | Armenia | 0,798 | 73,6 | 99,5 | 74,6 | 5 693 | 16 | |
| 85 | Ukraine | 0,796 | 68,2 | 99,7 | 90,0 | 6 914 | 9 | |
| 86 | Azerbaijan | 0,787 | 70,0 | 99,5 | 66,2 | 7 851 | -2 | |
| 87 | Thailand | 0,783 | 68,7 | 94,1 | 78,0 | 8 135 | -5 | |
| 88 | Iran (Islamic Republic of) | 0,782 | 71,2 | 82,3 | 73,2 | 10 955 | -17 | |
| 89 | Georgia | 0,778 | 71,6 | 100,0 | 76,7 | 4 662 | 21 | |
| 90 | Dominican Republic | 0,777 | 72,4 | 89,1 | 73,5 | 6 706 | 7 | |
| 91 | Saint Vincent and the Grenadines | 0,772 | 71,4 | 88,1 | 68,9 | 7 691 | -2 | |
| 92 | China | 0,772 | 72,9 | 93,3 | 68,7 | 5 383 | 10 | |
| ,,,/,,, | ||||||||
| 157 | Uganda | 0,514 | 51,9 | 73,6 | 62,3 | 1 059 | 6 | |
| 158 | Nigeria | 0,511 | 47,7 | 72,0 | 53,0 | 1 969 | -17 | |
| LOW HUMAN DEVELOPMENT | ||||||||
| 159 | Togo | 0,499 | 62,2 | 53,2 | 53,9 | 788 | 11 | |
| ,,,/,,, | ||||||||
| 176 | Congo (Democratic Republic of the) | 0,389 | 47,6 | 67,2 | 48,2 | 298 | 5 | |
| 177 | Burkina Faso | 0,389 | 52,7 | 28,7 | 32,8 | 1 124 | -16 | |
| 178 | Mali | 0,371 | 48,1 | 26,2 | 46,9 | 1 083 | -16 | |
| 179 | Central African Republic | 0,369 | 46,7 | 48,6 | 28,6 | 713 | -5 | |
| 180 | Sierra Leone | 0,365 | 47,3 | 38,1 | 44,6 | 679 | -5 | |
| 181 | Afghanistan | 0,352 | 43,6 | 28,0 | 50,1 | 1 054 | -17 | |
| 182 | Niger | 0,340 | 50,8 | 28,7 | 27,2 | 627 | -6 | |
| OECD | 0,932 | 79,0 | .. | 89,1 | 32 647 | .. | ||
| European Union (EU27) | 0,937 | 79,0 | .. | 91,0 | 29 956 | .. | ||
| Very high human development | 0,955 | 80,1 | .. | 92,5 | 37 272 | .. | ||
| Very high: OECD | .. | 80,1 | .. | 92,9 | 37 122 | .. | ||
| Very high: non-OECD | .. | 79,7 | .. | .. | 41 887 | .. | ||
| High human development | 0,833 | 72,4 | 94,1 | 82,4 | 12 569 | .. | ||
| Medium human development | 0,686 | 66,9 | 80,0 | 63,3 | 3 963 | .. | ||
| Low human development | 0,423 | 51,0 | 47,7 | 47,6 | 862 | .. | ||
| World | 0,753 | 67,5 | 83,9 | 67,5 | 9 972 | .. | ||
Rapport mondial sur le développement humain 2007-2008
"Sélection"
Petit commentaire : La France gagne 6 places par rapport au classement IDH précédent.
Au niveau mondial les inégalités sont toujours aussi criantes !Ainsi les habitants des pays les plus développés vivent en moyenne 28 ans de plus que les moins développés (48,5 ans pour 76,2 : + 57% !) et ont un revenu 22 fois supérieur (23 986 $ pour 1 112 par habitant !).
En terme de pollution ce sont surtout les pays riches les responsables, en particulier les États-Unis, 20,6 tonnes de CO2 par habitant pour "seulement" 6 pour la France !
Pour le taux d'incarcération, c'est-à-dire le nombre de prisonniers pour 100 000 habitants il est de 738 aux États-Unis contre 85 pour la France ! Presque 9 fois plus ! C'est le taux le plus élevé au monde, plus que la Chine et plus que Cuba !
------------------------------
3 pages :
Crime et justice (sic).
L'Indicateur de Développement Humain en détail. (ci-dessous)
Voir la liste des pays :
------------------------------
L'Indicateur de Développement Humain en détail.
Ce tableau "Sélection" au format excel ou pdf / le tableau complet excel ou pdf
Human development index (HDI) value
2005Life expectancy at birth
(years)
2005Adult literacy rate
(% aged 15 and above)
1995-2005bCombined gross enrolment ratio for primary, secondary and tertiary education
(%)
2005GDP per capita
(PPP US$)
2005GDP per capita (PPP US$) rank minus HDI rankc HIGH HUMAN DEVELOPMENT 1 Iceland 0.968 81.5 .. 95.4 36,510 4 2 Norway 0.968 79.8 .. 99.2 41,420 1 3 Australia 0.962 80.9 .. 113.0 31,794 13 4 Canada 0.961 80.3 .. 99.2 33,375 6 5 Ireland 0.959 78.4 .. 99.9 38,505 -1 6 Sweden 0.956 80.5 .. 95.3 32,525 7 7 Switzerland 0.955 81.3 .. 85.7 35,633 -1 8 Japan 0.953 82.3 .. 85.9 31,267 9 9 Netherlands 0.953 79.2 .. 98.4 32,684 3 10 France 0.952 80.2 .. 96.5 30,386 8 11 Finland 0.952 78.9 .. 101.0 32,153 3 12 United States 0.951 77.9 .. 93.3 41,890 -10 13 Spain 0.949 80.5 .. 98.0 27,169 11 14 Denmark 0.949 77.9 .. 102.7 33,973 -6 15 Austria 0.948 79.4 .. 91.9 33,700 -6 16 United Kingdom 0.946 79.0 .. 93.0 33,238 -5 17 Belgium 0.946 78.8 .. 95.1 32,119 -2 18 Luxembourg 0.944 78.4 .. 84.7 60,228 -17 19 New Zealand 0.943 79.8 .. 108.4 24,996 9 20 Italy 0.941 80.3 98.4 90.6 28,529 1 21 Hong Kong, China (SAR) 0.937 81.9 .. 76.3 34,833 -14 22 Germany 0.935 79.1 .. 88.0 29,461 -2 23 Israel 0.932 80.3 97.1 89.6 25,864 3 24 Greece 0.926 78.9 96.0 99.0 23,381 5 25 Singapore 0.922 79.4 92.5 87.3 29,663 -6 26 Korea (Republic of) 0.921 77.9 .. 96.0 22,029 6 ,,,/,,, 70 Brazil 0.800 71.7 88.6 87.5 8,402 -3 MEDIUM HUMAN DEVELOPMENT 71 Dominica 0.798 75.6 88.0 81.0 6,393 19 72 Saint Lucia 0.795 73.1 94.8 74.8 6,707 15 73 Kazakhstan 0.794 65.9 99.5 93.8 7,857 1 74 Venezuela (Bolivarian Republic of) 0.792 73.2 93.0 75.5 6,632 14 75 Colombia 0.791 72.3 92.8 75.1 7,304 4 76 Ukraine 0.788 67.7 99.4 86.5 6,848 9 ,,,/,,, 155 Gambia 0.502 58.8 .. 50.1 1,921 -9 LOW HUMAN DEVELOPMENT 156 Senegal 0.499 62.3 39.3 39.6 1,792 -9 157 Eritrea 0.483 56.6 .. 35.3 1,109 6 158 Nigeria 0.470 46.5 69.1 56.2 1,128 4 159 Tanzania (United Republic of) 0.467 51.0 69.4 50.4 744 15 160 Guinea 0.456 54.8 29.5 45.1 2,316 -30 161 Rwanda 0.452 45.2 64.9 50.9 1,206 -1 162 Angola 0.446 41.7 67.4 25.6 2,335 -33 163 Benin 0.437 55.4 34.7 50.7 1,141 -2 164 Malawi 0.437 46.3 64.1 63.1 667 13 165 Zambia 0.434 40.5 68.0 60.5 1,023 3 166 Côte d'Ivoire 0.432 47.4 48.7 39.6 1,648 -17 167 Burundi 0.413 48.5 59.3 37.9 699 9 168 Congo (Democratic Republic of the) 0.411 45.8 67.2 33.7 714 7 169 Ethiopia 0.406 51.8 35.9 42.1 1,055 -5 170 Chad 0.388 50.4 25.7 37.5 1,427 -17 171 Central African Republic 0.384 43.7 48.6 29.8 1,224 -13 172 Mozambique 0.384 42.8 38.7 52.9 1,242 -16 173 Mali 0.380 53.1 24.0 36.7 1,033 -8 174 Niger 0.374 55.8 28.7 22.7 781 -1 175 Guinea-Bissau 0.374 45.8 .. 36.7 827 -4 176 Burkina Faso 0.370 51.4 23.6 29.3 1,213 -17 177 Sierra Leone 0.336 41.8 34.8 44.6 806 -5 Developing countries 0.691 66.1 76.6 64.1 5,282 .. Least developed countries 0.488 54.5 53.9 47.8 1,499 .. Arab States 0.699 67.5 70.3 65.5 6,716 .. East Asia and the Pacific 0.771 71.7 90.7 69.4 6,604 .. Latin America and the Caribbean 0.803 72.8 90.3 81.2 8,417 .. South Asia 0.611 63.8 59.5 60.3 3,416 .. Sub-Saharan Africa 0.493 49.6 60.3 50.4 1,998 .. Central and Eastern Europe and the CIS 0.808 68.6 99.0 83.5 9,527 .. OECD 0.916 78.3 .. 88.6 29,197 .. High-income OECD 0.947 79.4 .. 93.5 33,831 .. High human development 0.897 76.2 .. 88.4 23,986 .. Medium human development 0.698 67.5 78.0 65.3 4,876 .. Low human development 0.436 48.5 54.4 45.5 1,112 .. High income 0.936 79.2 .. 92.3 33,082 .. Middle income 0.776 70.9 89.9 73.3 7,416 .. Low income 0.570 60.0 60.2 56.3 2,531 .. World 0.743 68.1 78.6 67.8 9,543 ..
la copie est nécessaire le progrès l'exige.